

Getting the most out of Microsoft Excel Charts

A good chart shows the meaning of large amounts of data far better than the raw numbers. This 90-minute Excel charts training covers how to create and manage different types of charts, starting with the basics and building up to more complex combo charts.
You'll learn to create a chart from your data, customize and format it, change existing charts, and add data labels, titles and trendlines, including using a trendline to project future values.
The session also covers pie charts, combo charts and sparklines, saving and reusing chart templates, and linking Excel charts to Word, PowerPoint or Outlook.
- Create a chart from Excel data
- Customize and format charts
- Add data labels, titles and trendlines
- Use a trendline to forecast future values
- Build pie charts, combo charts and sparklines
- Save chart templates and link charts to Word and PowerPoint
- Creating a chart from Excel data
- Customizing and formatting charts
- Adding data labels, titles and trendlines
- Using a trendline to project into the future
- Pie charts
- Combo charts
- Sparklines
- Saving and reusing a chart template
- Linking an Excel chart to Word, PowerPoint or Outlook
Managers often ask for charts or changes to existing ones. Knowing how to build and adjust them yourself makes you the go-to person, saves time and helps your team present data clearly.
This session suits business owners, executives, managers, administrators, salespeople, trainers, bankers and anyone who uses Excel regularly.
- Business owners
- CEO’s / CFO’s / CTO’s
- Managers of all levels
- Anybody who uses Excel on a regular basis, and want to be more efficient and productive
- Administrators
- Salespeople
- Trainers
- Bankers
Tom Fragale is a computer professional with over 30 years of professional experience. He has trained over 30,000 business people in on-line webinars, public seminars, and on-site training. His clients include many Fortune 500 companies, government agencies, military bases, and companies large and small across many industries, including manufacturing, banking, pharmaceutical, education, retail, etc. He started his career as a database application programmer and has served as a consultant and project manager on many successful projects. His topics of expertise include: Access, Excel, Word, PowerPoint, Outlook, Crystal Reports, SQL Server, Visio, QuickBooks, and SharePoint, among others. His passion is training people and helping people get the most out of their computers, and he is a published author having written a book on Microsoft Access. He graduated in 1988 from LaSalle University in Philadelphia, PA with a BA in Computer Science.
Upcoming Webinars

By William Mack Copeland
Date: Nov. 6, 2026
By Carolyn Troiano
Date: Nov. 6, 2026

By Edwin Waldbusser
Date: Nov. 9, 2026

By Dev Strischek
Date: Nov. 9, 2026

By Cathy Horwitz
Date: Nov. 10, 2026

By Paul Pelletier
Date: Nov. 10, 2026

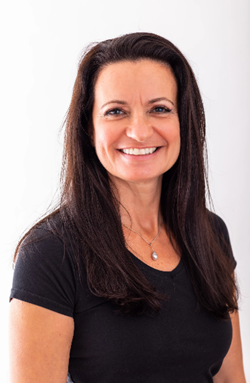
By Lesley Crook
Date: Nov. 13, 2026

By Dr. Susan Strauss
Date: Nov. 16, 2026



By Allen Evitts
Date: Nov. 17, 2026

By Dr. Bill Trombetta
Date: Nov. 17, 2026

By David Nettleton
Date: Nov. 17, 2026

By Bruce Lee
Date: Nov. 17, 2026


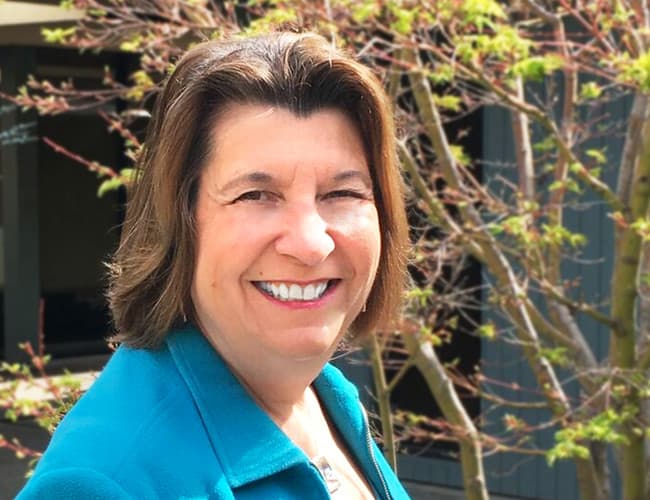

By Dr. Susan Strauss
Date: Nov. 18, 2026

By Mike Thomas
Date: Nov. 18, 2026

By Donna K Olheiser
Date: Nov. 19, 2026

By Charles H. Paul
Date: Nov. 19, 2026
By Diane L. Dee
Date: Nov. 19, 2026

By Abdelrahman Abdou
Date: Nov. 19, 2026


By Richard E Cascarino
Date: Nov. 20, 2026
By Edwin Waldbusser
Date: Nov. 23, 2026

By Meredith Crabtree
Date: Nov. 24, 2026
By Pete Tosh
Recorded Session
By Bruce Lee
Recorded Session

By Don Phin
Recorded Session


By Dr. Susan Strauss
Recorded Session


By Margie Faulk
Recorded Session


By Carolyn Troiano
Recorded Session

By Kelly Thomas
Recorded Session

By Rachelle D Souza
Recorded Session
By Marcia Zidle
Recorded Session

By Beverly Beuermann-King
Recorded Session
By Margie Faulk
DOL Reverses Course on Independent Contractor Rule for 2026! How Will Employers Adapt to the Change?
Recorded Session
By Mike Thomas
Recorded Session
By Marcia Zidle
Recorded Session

By Ritu Arora
Recorded Session
By Diane L. Dee
Recorded Session
By Dr. Susan Strauss
Recorded Session
By Diane L. Dee
Recorded Session
By Beverly Beuermann-King
Recorded Session
By Charles H. Paul
Recorded Session
By Marcia Zidle
Recorded Session

By Audrey Halpern
Recorded Session